RANKIF formula using SUMPRODUCT

In many cases, while working on your analysis you need to rank your dataset based on changing specific criteria.
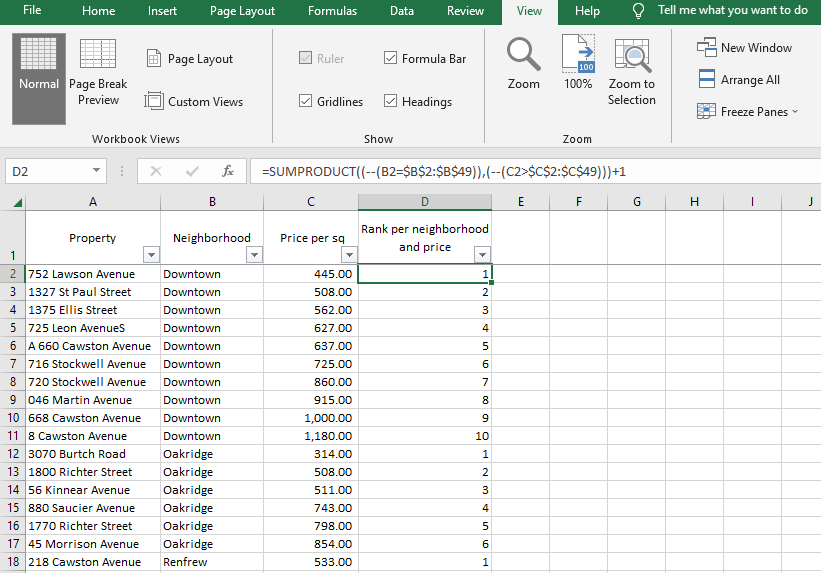
The below formula example allows you to rank a specific value within a dataset based on two criterias: the neighborhood and price per square foot of each specific property in the range.
The higher the rank, the more expensive the property is compared to other properties in the same neighborhood.
Overall, this formula is useful for determining the relative value of a specific property based on its neighborhood and price per square foot, and could be used in real estate analysis, property appraisals, sales, product analysis, employee performance, academic performance, or other similar contexts.
Please see the below example:
RANKIF formula explained
Let me explain how the formula works.
Formula syntax:
=SUMPRODUCT((--(B2=$B$2:$B$49)),(--(C2>$C$2:$C$49)))+1
Column A contains the unique names of real estate properties
Column B contains the names of neighborhoods in the city
Column C contains the price per square foot for each property
The data is sorted by neighborhood and then by price per square foot of the property. You don't need change the range of the formula if one of the criteria changes, just copy the formula down and get the correct ranking.
The SUMPRODUCT function is used to multiply ranges of cells and then return the sum of the products.
The formula is comparing the neighborhood and price of a specific cell ( for example in the first row B2 and C2) to all cells in the range of B2:B49 and C2:C49 respectively.
The -- operator is used to convert the result of the comparison to a Boolean value (TRUE or FALSE) and then to a numeric value (1 or 0)
It's a powerful function that can be used in combination with other functions to analyze the data and draw valuable insights.
Usefulness
The above RANKIF formula can be used for many different types of analysis.
For example:
-
Real estate analysis: The function can be used to rank properties based on their neighborhood and price per square foot, which can be useful for determining relative property values and identifying areas with high or low prices.
-
Sales analysis: The function can be used to rank salespeople based on their sales figures, which can be useful for identifying top performers and identifying areas for improvement.
-
Product analysis: The function can be used to rank products based on their sales figures, which can be useful for identifying top-selling products and identifying areas for improvement.
-
Employee performance: The function can be used to rank employees based on their performance metrics, which can be useful for identifying top performers and identifying areas for improvement.
-
Academic performance: The function can be used to rank students based on their grades, which can be useful for identifying top performers and identifying areas for improvement.
-
Investment performance: The function can be used to rank investments based on their returns, which can be useful for identifying top performers and identifying areas for improvement.